Insights and dashboards
Build your own charts from any event, group people into cohorts, and arrange them on dashboards.
An insight is a chart you build from your own events: a trend, a funnel, retention, paths, stickiness or lifecycle. Save insights, then arrange them with VoidQL queries on dashboards. Insights, cohorts and dashboards are available on Voidhash Cloud, under Analytics → Insights and Analytics → Dashboards.
Insights and dashboards are in early access. Ask us on Discord, or email support@voidhash.com on a paid plan, to turn them on for your team.
Create an insight
Open Analytics → Insights and click New insight. Then:
- Choose a type, such as Trends.
- Give it a Name and say what to count. For Trends, that's a series: an Event name and a Measure.
- Set the options, such as Break down by and Range: Last 7 days (the default), Last 30 days or Last 90 days.
- Click Run to preview it, then Save.
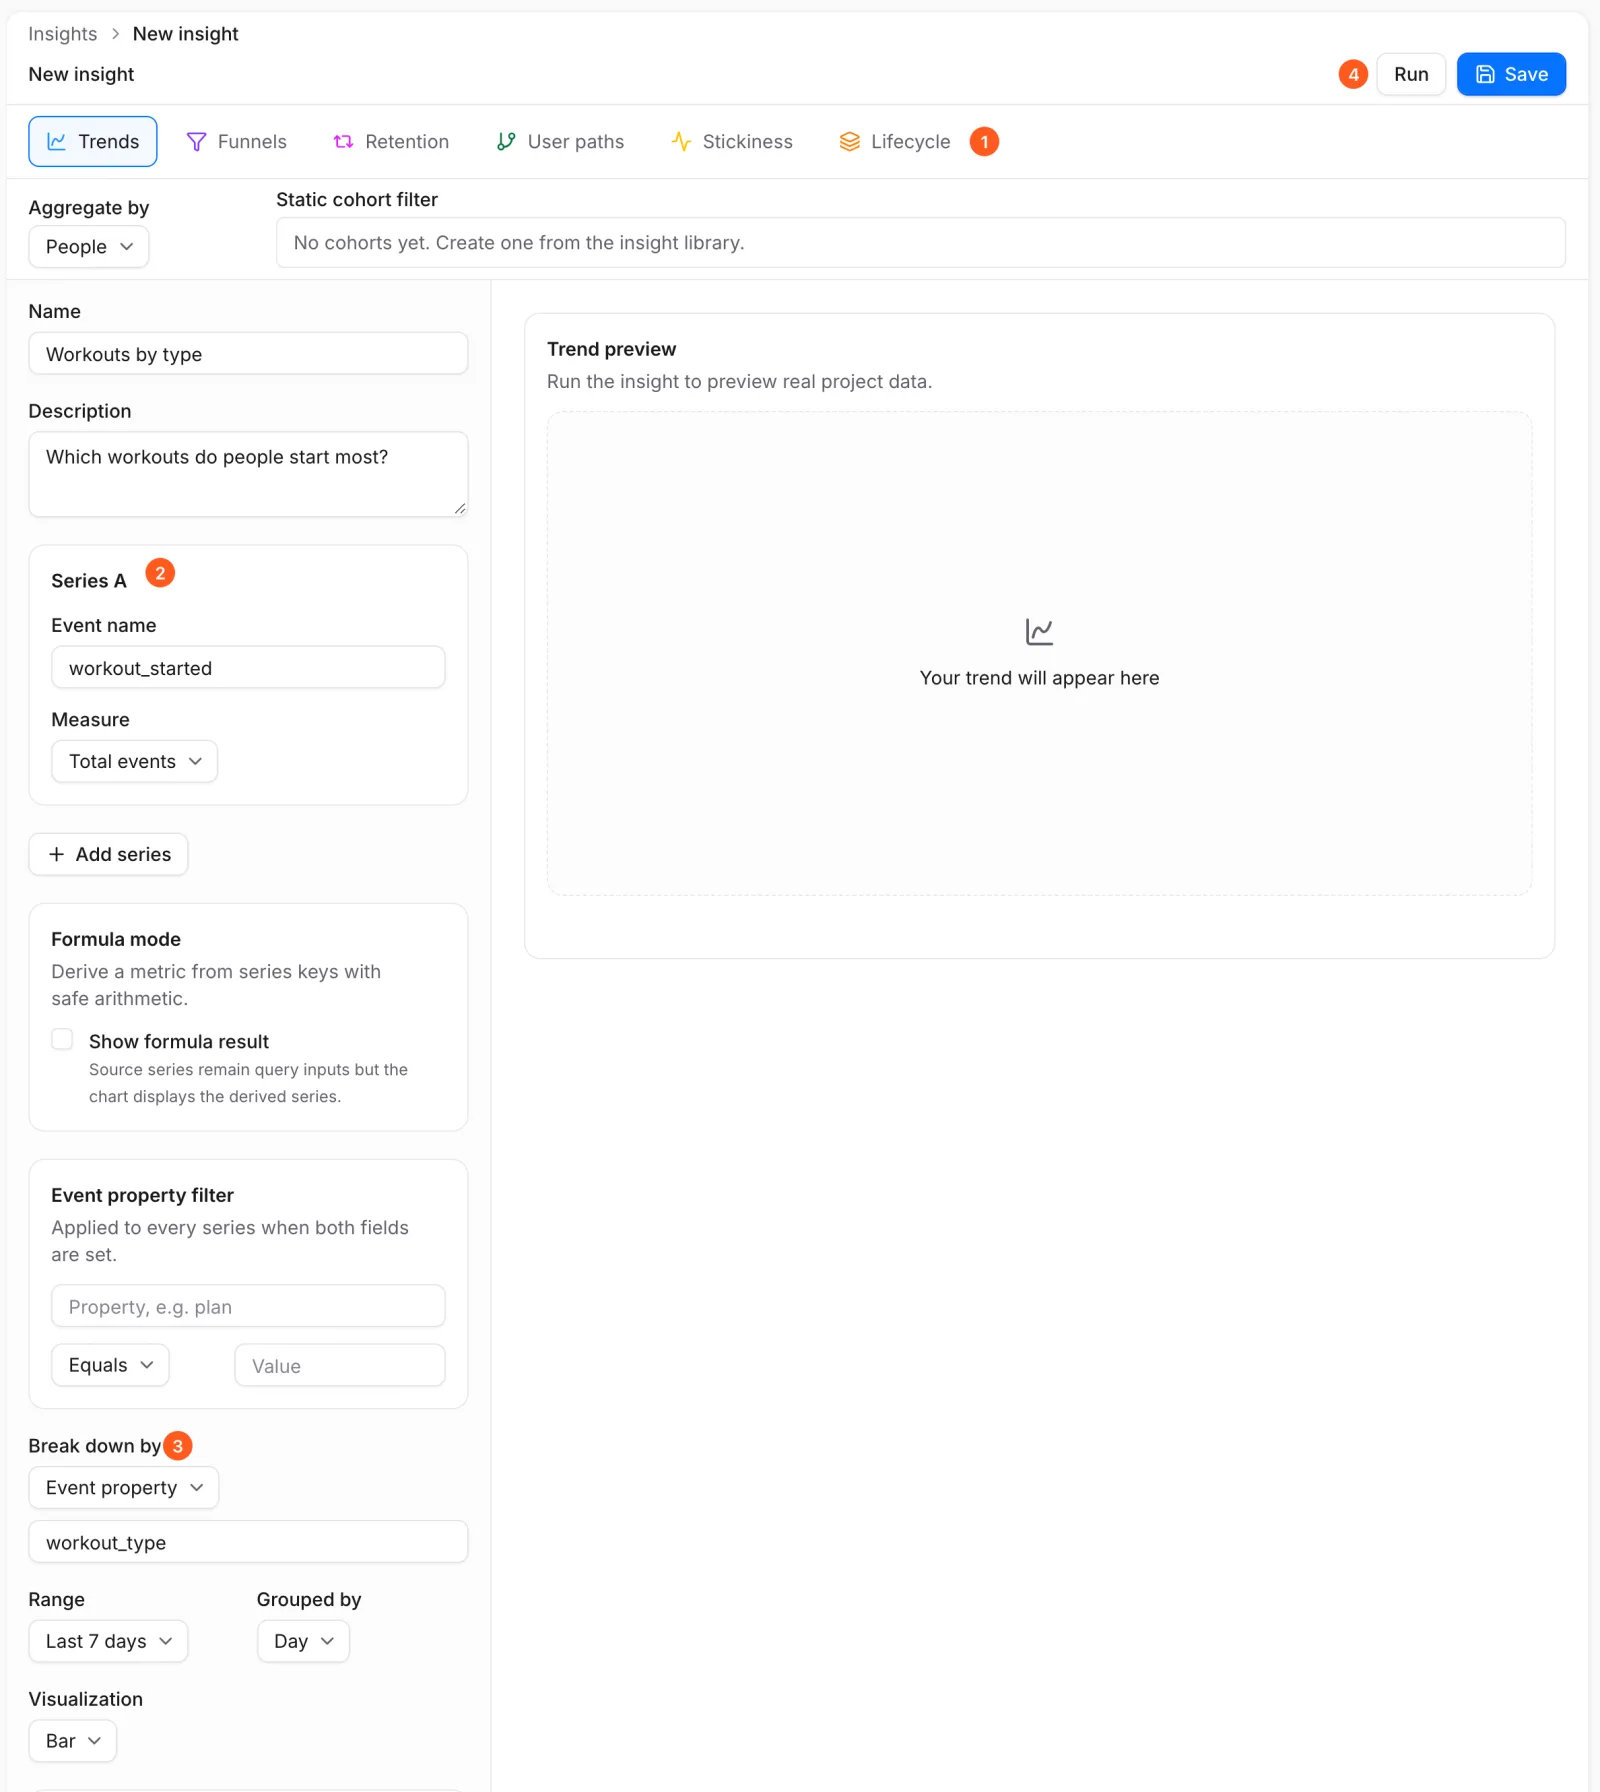 (1) type tabs · (2) the series · (3) Break down by · (4) Run
Every type can be narrowed with a Static cohort filter (see Cohorts). Select a value in a preview to list the people behind it. Save returns you to the list of saved insights. Saved insights can't be opened or edited: to change one, create it again and delete the old one (click its Delete insight icon twice).
Insight types
| Type | Answers | Main options |
|---|---|---|
| Trends | How often an event happens, or how many people do it, over time. | Up to 8 series, each an event and a measure; up to 8 formulas such as A / B * 100; Break down by; Compare with the previous period or year. |
| Funnels | How many people complete a sequence of events. | Steps; Step order; Conversion window of 1, 7 (default), 14 or 30 days; breakdowns. |
| Retention | How many people come back after a first action. | Cohort event and Returning event; Period of a day, week or month; 7, 11 or 14 Intervals; Rolling retention. |
| User paths | Which routes people take between screens or events. | Path steps of screen names or event names; Start at and End at; Session gap of 15, 30 or 60 minutes. |
| Stickiness | How many periods people repeat an action in. | Frequency, Interval and Events per interval. |
| Lifecycle | How many people are new, returning, resurrecting or dormant. | Lifecycle event; Period; people or percentages. |
Trends measures are Unique users, Total events, or the sum, average, minimum, maximum,
median, or 75th, 90th, 95th or 99th percentile of an event property. A formula refers to series by
letter and supports +, -, *, /, %, parentheses, and powers written as two asterisks.
Dividing by zero gives 0.
Funnels step orders:
| Order | Counts a person when |
|---|---|
| Sequential (default) | They do the steps in order, with other events in between allowed. |
| Strict adjacency | They do the steps in order with nothing in between. |
| Any order | They do every step, in any order. |
Cohorts
A static cohort is a fixed list of people, such as your beta testers. Use it to narrow any insight.
- On Analytics → Insights, find the Static cohorts card.
- Enter a Cohort name and an optional Description.
- Under Members, search people by name, ID or email and tick them.
- Click Create cohort.
A cohort doesn't change on its own: add or remove people with Edit cohort. A cohort can also be the audience of a scheduled automation.
Dashboards
A dashboard arranges saved insights and saved VoidQL queries as tiles.
- Open Analytics → Dashboards, click New dashboard, give it a Name and an optional Description, and click Create dashboard. The dashboard opens.
- Pick an insight or query under Choose a saved insight, and click Add. Saved queries are listed as Query · and their name.
- Click Edit layout to arrange tiles. Each tile can Move up, Move down, switch between Full width and Half width, switch between Tall card and Standard height, or be removed with Remove from dashboard. Click Done when finished.
Duplicate copies a dashboard. Details renames it, changes its description, or deletes it with Delete dashboard.
If something's off
- No Insights or Dashboards in the sidebar: they're in early access and only on Voidhash Cloud.
- An insight shows nothing: the event name doesn't match what your app records. Check Activity → Analytics events.
- You need to change a saved insight: create it again and delete the old one.
Next steps
- Query with VoidQL
- Reports
- Events (developer docs)
Still stuck? Check Troubleshooting, ask us on Discord, or email support@voidhash.com on a paid plan.
Something wrong or missing on this page? Tell us by email or on Discord.