Reports
What each built-in analytics page in Studio answers, and the charts and filters it has.
Each page under Analytics answers one question. Reports fill in once your developers have added the SDK and connected a store.
Common questions
| Question | Where to look |
|---|---|
| How much did we make last month? | Revenue, range 3m, granularity Monthly. |
| Is MRR growing? | MRR and MRR movements on Revenue. |
| Do trials turn into payers? | Trial conversion rate on Trials. |
| Why are people leaving? | Churn by reason on Churn. |
| Which paywall sells best? | Revenue by paywall and Paywall conversion on Paywalls. |
| Does revenue match App Store Connect? | Compare Proceeds; see Check a number against App Store Connect. |
| Did the last release break something? | Events by name on Data health, with Mark releases and changes on. |
| Do people come back? | Retention cohorts on Audience. |
| Where do paying people come from? | Revenue by acquisition on Acquisition. |
| Which version crashes? | Version quality and Crash-free people on App. |
| Why is a chart empty? | Why a chart is empty. |
Controls
Every page has the same controls at the top:
- Range: 12m, 3m, 30d (the default), 7d or Today.
- Granularity: Daily (the default), Weekly or Monthly.
- Filter: Platform, Country, App version, Product and Store, each offered when a chart on the page supports it and your project had more than one value in the last 90 days. A chart a filter skips says Not narrowed by it.
- View settings, on pages with time charts (all but Locations):
- Compare to previous period draws the previous range as a second line. It is off by default.
- Mark releases and changes draws paywall deploys, new app versions, feature flag rollouts and ad changes on time charts. It is on by default.
Some charts have their own choices, such as Group by or Metric. A value far outside its usual range is marked Unusual. An empty chart that reads built-in events names them; see Why a chart is empty. Every page's charts are listed in the chart reference.
Revenue
How much you earn and what moves it: revenue, MRR, ARR and each MRR movement.
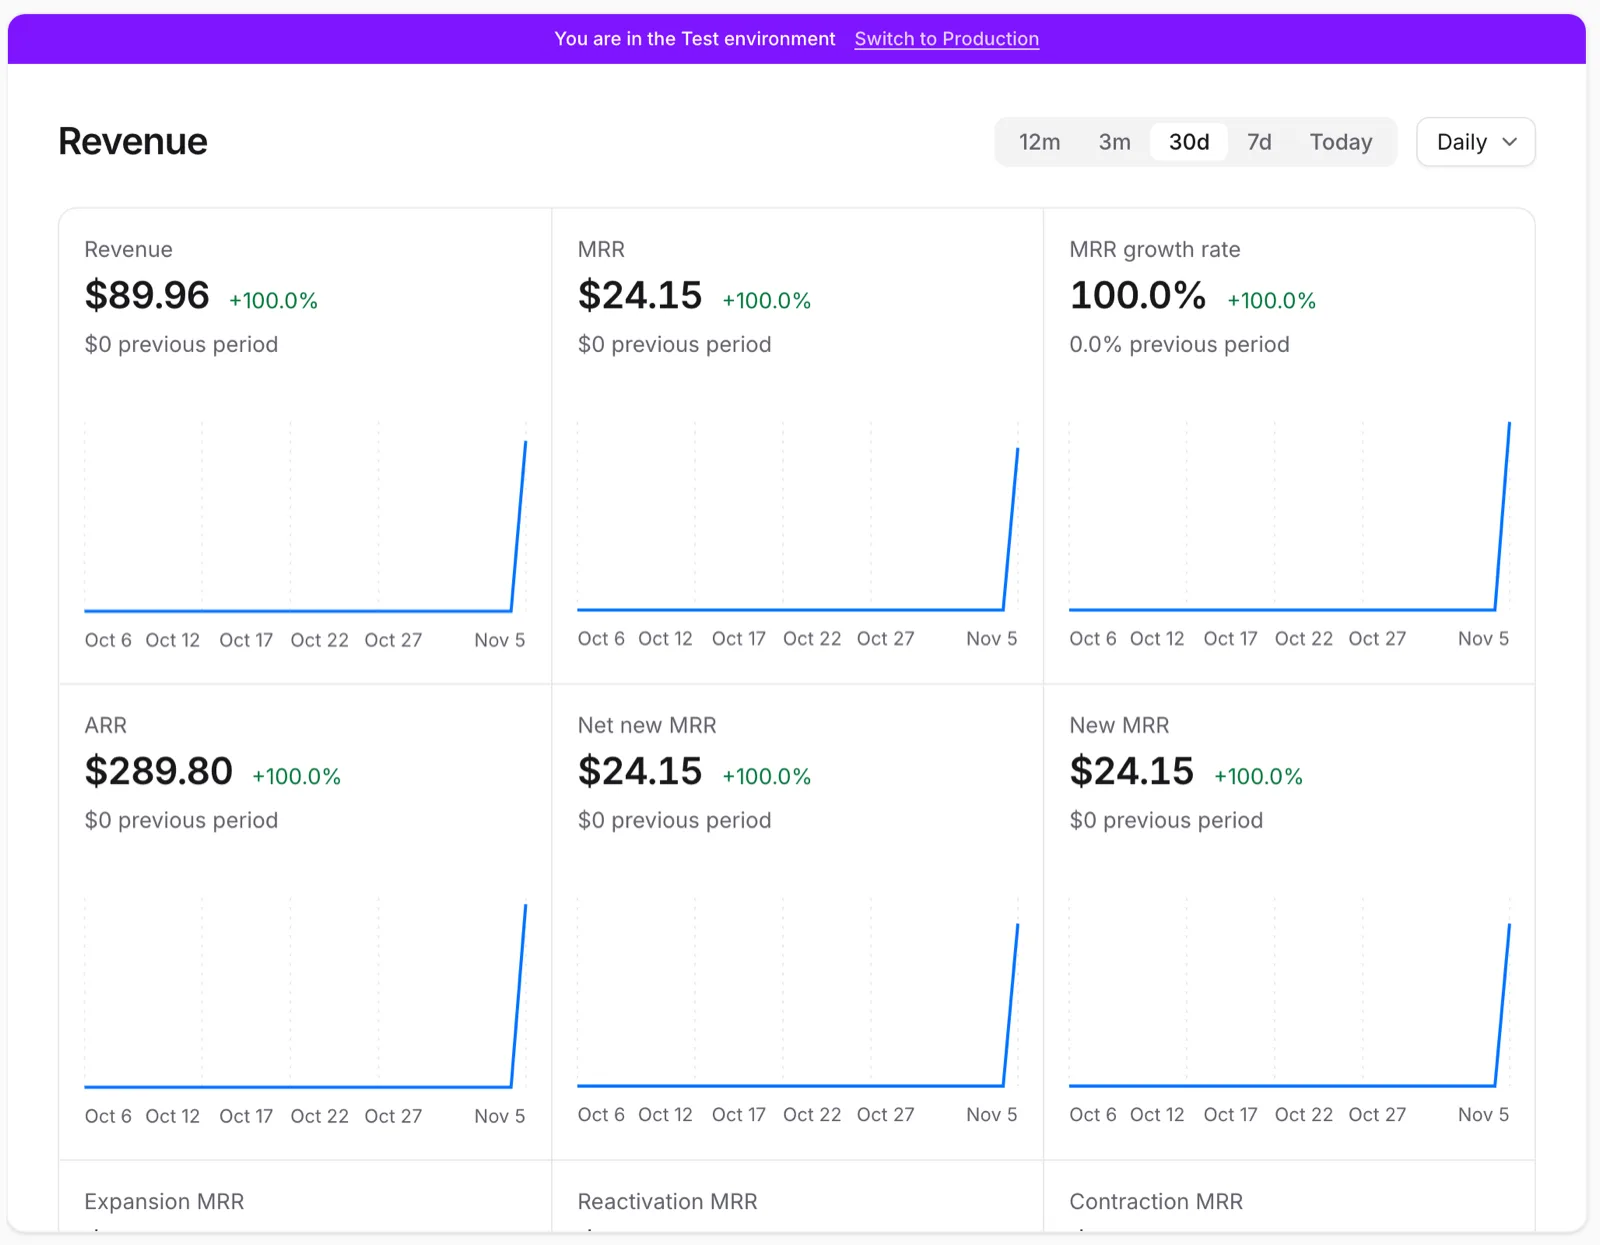 Headline cards at the top, charts with the detail below
Start with MRR, MRR movements and Gross to net. The chart reference lists every card and chart.
Subscribers
Who pays, what they can use, and what they're worth over time.
Start with Subscribers by plan, Subscriber movements and Lifetime value by cohort. The chart reference lists every card and chart.
Trials
How many trials start and how many pay.
Start with the Trial conversion rate card, Trial start rate and When trials cancel. The chart reference lists every card and chart.
Churn
Who leaves, why, and who comes back.
Start with Churn by reason, Subscriber survival by plan and MRR at risk. The chart reference lists every card and chart.
Billing retry and grace periods are explained in Subscription lifecycle (developer docs).
Audience
How people use your product and how often they return.
Start with Active people, Retention cohorts and Top events. The chart reference lists every card and chart.
Paywalls
How your paywalls and A/B tests convert.
Start with Paywall funnel, Paywall conversion and Revenue per 1,000 views. The chart reference lists every card and chart.
Acquisition
Where paying people come from, by channel and campaign; see Ad measurement. No filters.
Start with Revenue by acquisition, Cost per new payer and Blended return. The chart reference lists every card and chart.
Web
Website traffic and how it turns into signups. Needs the web SDK (developer docs).
Start with Traffic, Top referrers and Landing page conversion. The chart reference lists every card and chart.
App
Installs, versions and devices of your mobile apps.
Start with Installs, Version quality and Crash-free people. The chart reference lists every card and chart.
Locations
Where your people are and which markets pay. Cities with fewer than five people are hidden.
Start with World map, Countries and Opportunity. The chart reference lists every card and chart.
Push
Whether push notifications arrive and what they bring back.
Start with Push delivery, Push open rate and Return after a push. The chart reference lists every card and chart.
Data health
Whether your events and store notifications arrive complete and on time. See Check your data.
Why a chart is empty
An empty chart says No data in this period. A chart that reads built-in events also names them ("It reads …") and adds "Check they are switched on and that your SDK is up to date." Check, in order:
- Nothing happened in this range. Widen the Range, or check the environment in the project switcher.
- One of the named events is turned off. Look it up in Settings → Events; ask an admin or the owner to turn it on. Reports fill in from then on, not for the time it was off.
- The app doesn't send them, or runs an old SDK. Pass the event names to your developers; see Events (developer docs).
If something's off
- A filter is missing: no chart on the page supports it, or your project has only one value for it in the last 90 days.
- Numbers differ from the store: see Numbers look wrong.
Next steps
Still stuck? Check Troubleshooting, ask us on Discord, or email support@voidhash.com on a paid plan.
Something wrong or missing on this page? Tell us by email or on Discord.